PerformanceMonitor
by erikdarlingdata·★ 380·综合分 53
SQL Server 性能监控工具,内置 MCP 服务器,用于 AI 驱动的等待统计和查询性能分析。
概述
PerformanceMonitor 是一个全面的 SQL Server 监控解决方案,提供完整版(基于数据库)和轻量版(桌面应用程序)。它包含 32+ 个专门的 T-SQL 收集器、实时警报、图形化计划查看器,以及集成的 MCP 服务器,提供 51-63 个只读工具用于 AI 分析。该工具支持 SQL Server 2016-2025、Azure SQL 和 AWS RDS,所有数据本地存储,遥测和云依赖为零。
试试问 AI
装完之后,这里有 5 个你可以让 AI 做的事:
什么时候选它
如果您需要 AI 驱动的 SQL Server 性能分析,不想支付第三方工具订阅费,并希望所有数据保持本地,请选择此工具。
什么时候不要选它
如果您需要跨不同数据库类型的多数据库监控,或者需要从 AI 工具获得写入权限,则不适合使用此工具。
此 server 暴露的工具
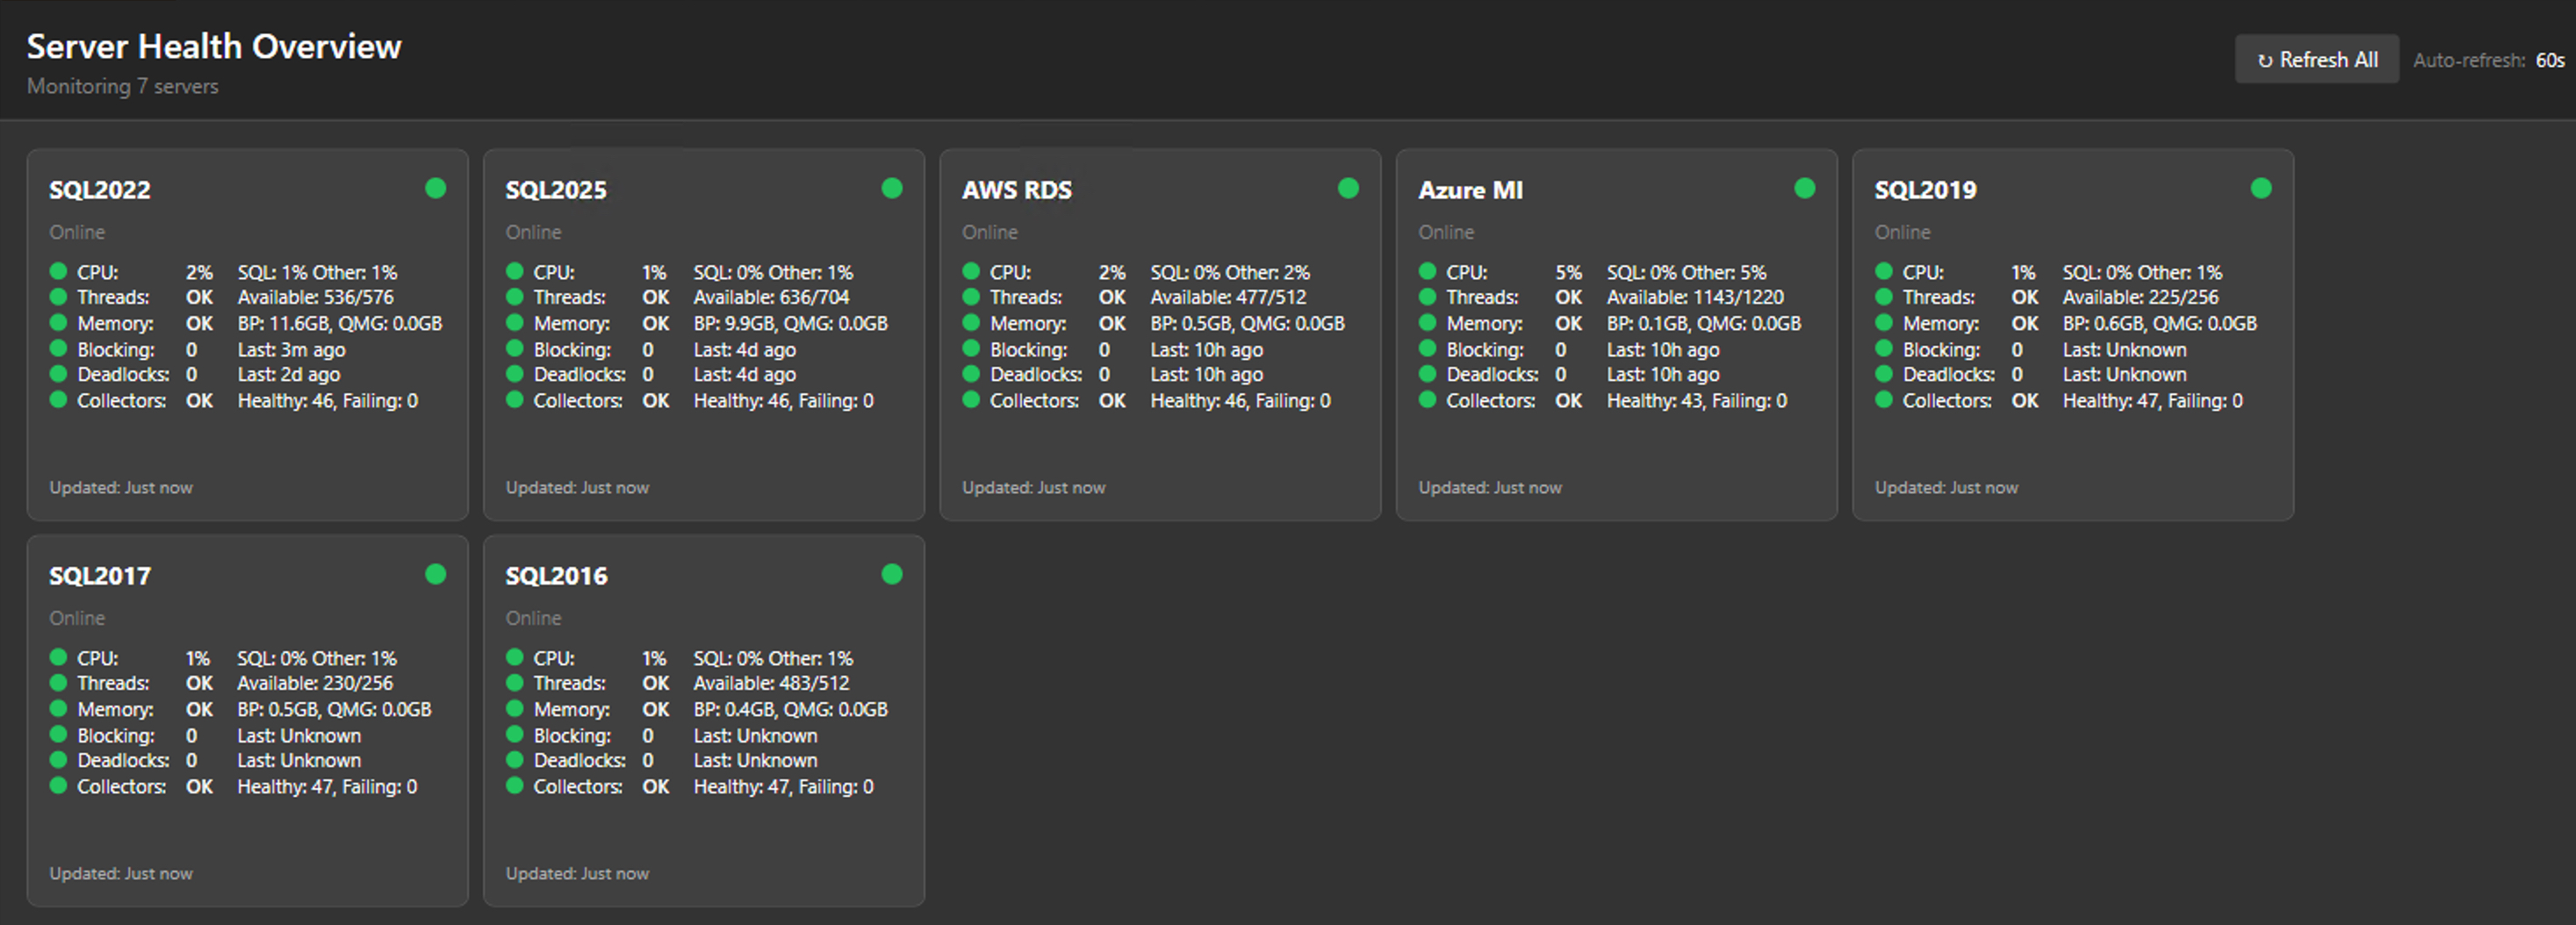
从 README 抽取出 12 个工具get_server_healthGet overall server health status with green/yellow/red indicators
get_top_wait_typesIdentify the top wait types currently affecting server performance
analyze_query_performanceAnalyze slow or problematic queries with execution plans
check_blocking_chainsIdentify current blocking chains between sessions
analyze_deadlocksAnalyze recent deadlock events and their causes
get_memory_grant_statsCheck memory grant statistics for queries
analyze_file_ioAnalyze file I/O performance and bottlenecks
check_tempdb_usageMonitor tempdb space usage and potential issues
get_performance_countersRetrieve performance counters for the server
analyze_query_storeAnalyze query store data for query performance trends
check_job_performanceAnalyze SQL Agent job execution performance
get_database_sizesGet current database size statistics and growth trends
说明:Tools are mentioned in the 'Built-in MCP server with 51-63 read-only tools for AI analysis' section, though specific tool names are not explicitly listed. The tool names and descriptions are inferred from the collectors mentioned in the doc
可对比工具
安装
安装选项
- **完整版(基于服务器)**:
- 下载 PerformanceMonitorInstaller.exe - 使用服务器名运行:PerformanceMonitorInstaller.exe YourServerName - 对于 SQL 身份验证:PerformanceMonitorInstaller.exe YourServerName sa YourPassword
- **轻量版(桌面)**:
- 下载 PerformanceMonitorLite.exe - 运行可执行文件并通过 UI 添加服务器连接
Claude Desktop 配置
添加到您的 Claude Desktop config.json:
{
  "mcpServers": {
    "performance-monitor": {
      "command": "PerformanceMonitorLite.exe",
      "args": ["--mcp"]
    }
  }
}
FAQ
- 支持哪些 SQL Server 版本?
- 支持 SQL Server 2016-2025、Azure SQL 托管实例、AWS RDS for SQL Server 以及 Azure SQL 数据库(仅限轻量版)。
- MCP 服务器需要特殊权限吗?
- MCP 服务器与监控工具使用相同的权限。轻量版需要 VIEW SERVER STATE 权限,完整版需要 SQL Agent 权限。
PerformanceMonitor 对比
最后更新于 · 由 README + GitHub 公开数据自动生成。