PerformanceMonitor
by erikdarlingdata·★ 380·Score 53
SQL Server performance monitoring tool with built-in MCP server for AI-powered analysis of wait stats and query performance.
Overview
PerformanceMonitor is a comprehensive SQL Server monitoring solution that provides both a full edition (database-based) and a lite edition (desktop application). It features 32+ specialized T-SQL collectors, real-time alerts, graphical plan viewer, and an integrated MCP server exposing 51-63 read-only tools for AI analysis. The tool supports SQL Server 2016-2025, Azure SQL, and AWS RDS, with all data stored locally - no telemetry or cloud dependencies.
Try asking AI
After installing, here are 5 things you can ask your AI assistant:
When to choose this
Choose this if you need AI-powered SQL Server performance analysis without third-party tool subscriptions and prefer keeping all data local.
When NOT to choose this
Not suitable if you need multi-database monitoring across different database types or require write access capabilities from your AI tools.
Tools this server exposes
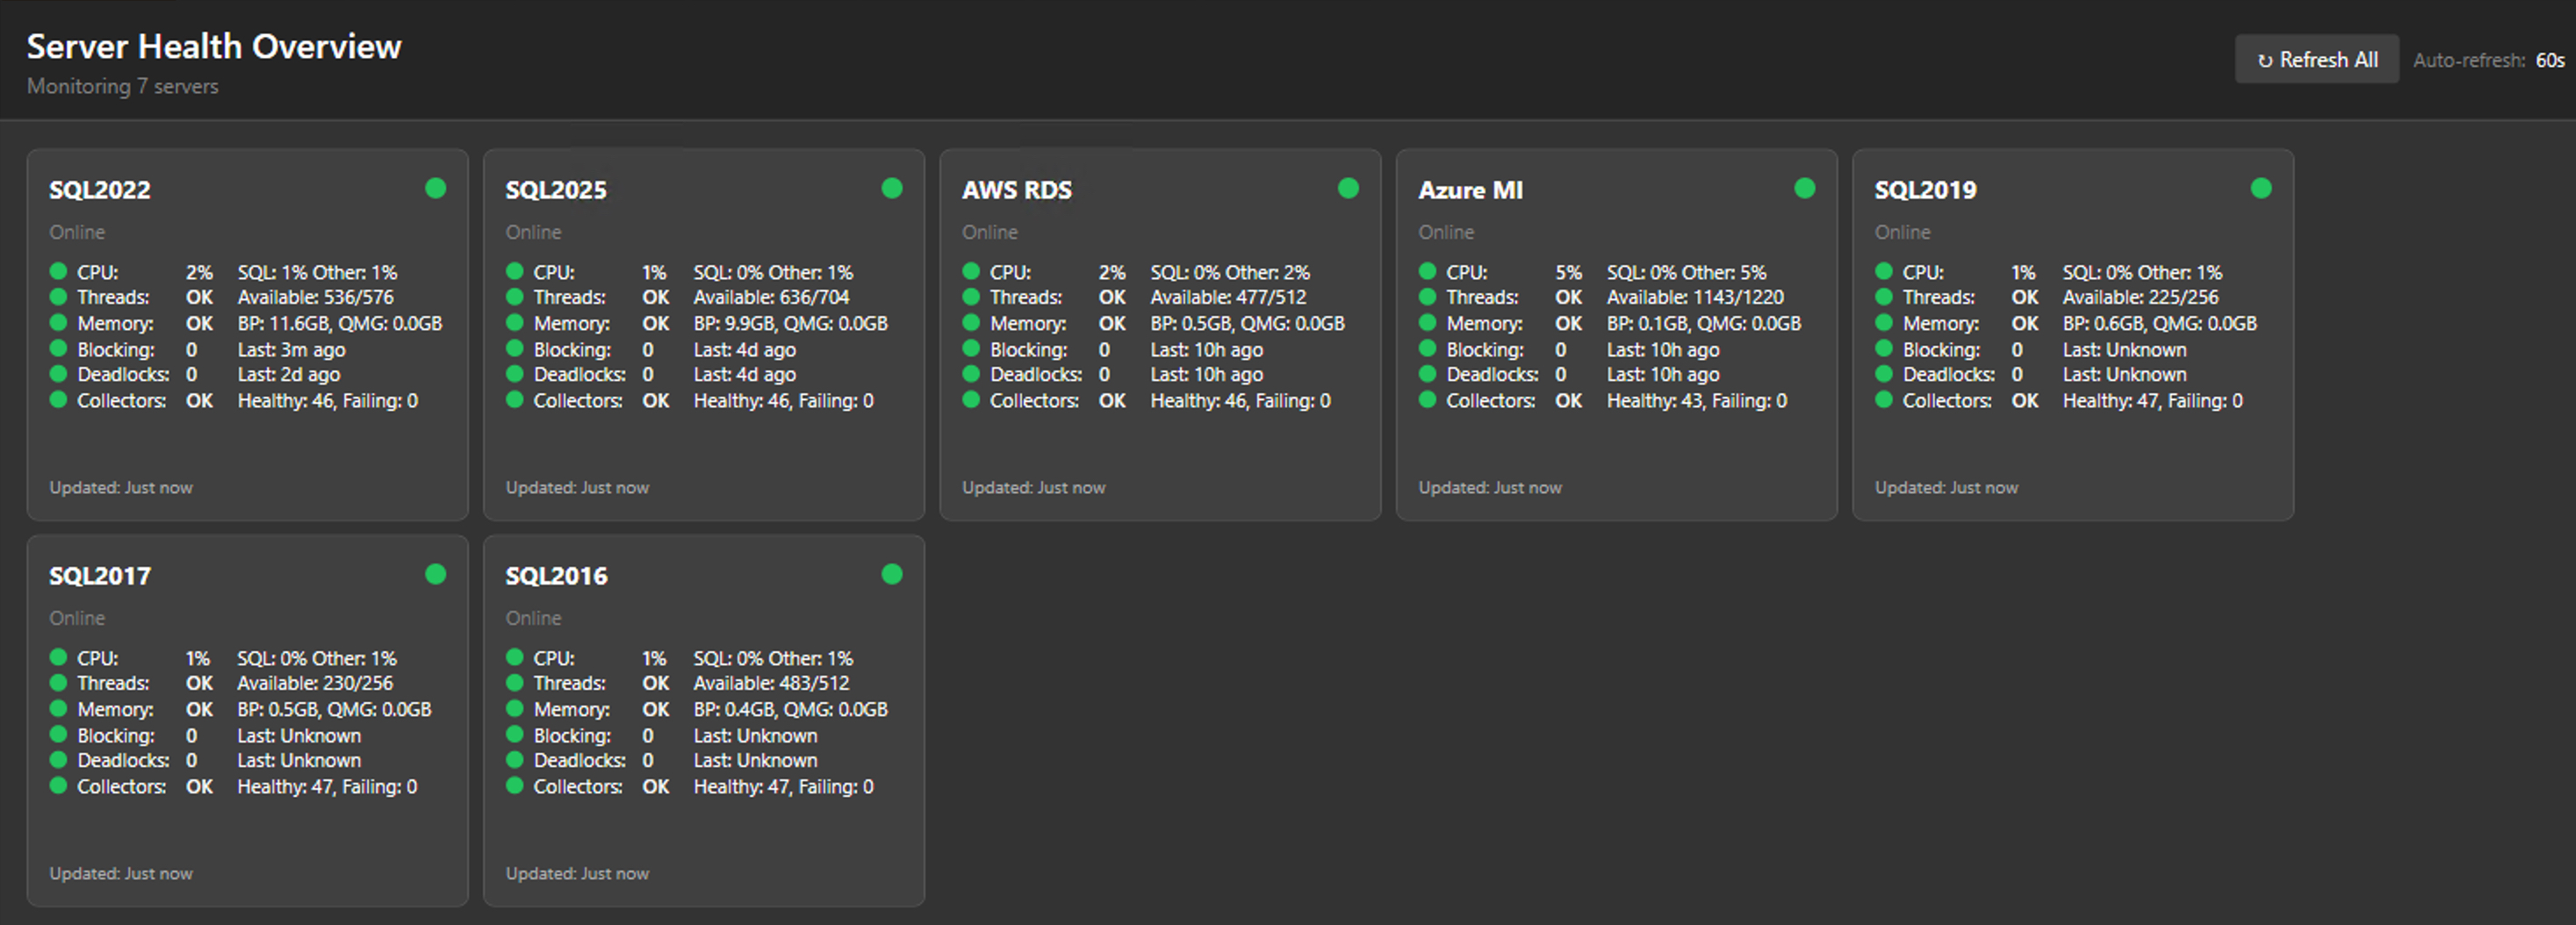
12 tools extracted from the READMEget_server_healthGet overall server health status with green/yellow/red indicators
get_top_wait_typesIdentify the top wait types currently affecting server performance
analyze_query_performanceAnalyze slow or problematic queries with execution plans
check_blocking_chainsIdentify current blocking chains between sessions
analyze_deadlocksAnalyze recent deadlock events and their causes
get_memory_grant_statsCheck memory grant statistics for queries
analyze_file_ioAnalyze file I/O performance and bottlenecks
check_tempdb_usageMonitor tempdb space usage and potential issues
get_performance_countersRetrieve performance counters for the server
analyze_query_storeAnalyze query store data for query performance trends
check_job_performanceAnalyze SQL Agent job execution performance
get_database_sizesGet current database size statistics and growth trends
Note: Tools are mentioned in the 'Built-in MCP server with 51-63 read-only tools for AI analysis' section, though specific tool names are not explicitly listed. The tool names and descriptions are inferred from the collectors mentioned in the doc
Comparable tools
Installation
Installation Options
- **Full Edition (Server-based)**:
- Download PerformanceMonitorInstaller.exe - Run with server name: PerformanceMonitorInstaller.exe YourServerName - For SQL Authentication: PerformanceMonitorInstaller.exe YourServerName sa YourPassword
- **Lite Edition (Desktop)**:
- Download PerformanceMonitorLite.exe - Run the executable and add server connections via the UI
Claude Desktop Configuration
Add to your Claude Desktop config.json:
{
  "mcpServers": {
    "performance-monitor": {
      "command": "PerformanceMonitorLite.exe",
      "args": ["--mcp"]
    }
  }
}
FAQ
- What SQL Server versions are supported?
- SQL Server 2016-2025, Azure SQL Managed Instance, AWS RDS for SQL Server, and Azure SQL Database (Lite edition only).
- Does the MCP server require special permissions?
- The MCP server runs with the same permissions as the monitoring tools. Lite edition requires VIEW SERVER STATE. Full edition requires SQL Agent permissions.
Compare PerformanceMonitor with
Last updated · Auto-generated from public README + GitHub signals.